


 |
> McKissock Learning
> OREP E&O |
The Danger Zone
by Scott Cullen, MNAA
The danger zone is anytime within a twelve-month period when the market changes. USPAP is clear on the appraiser’s responsibility. According to SR 1-3 lines 515 and 516, “An appraiser must avoid making an unsupported assumption or premise about market area trends, effective age, and remaining economic life.” Use of the cost approach to support effective age and remaining economic life has not changed. But we need to get better with market area trends.
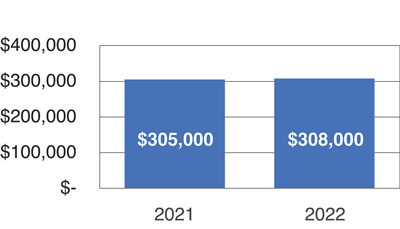
Real estate market trends are often analyzed with year-over-year comparisons. “The median price in the subject neighborhood has increased 1% from the prior 365 days to the current 365 days,” says Elliot’s Brief Blog from November 1st 2022 (see Figure 1).
Enlarge image
Figure 1: Median Price year-over-year
The advantage of a bar chart with one-year periods is that it eliminates seasonality from the market. Where I work in Minnesota, there is a seasonal trend with market peaks around June, steady through early fall, and down from there until the following spring. My uncle John, a seasoned real estate agent summed it up as “nothing happens between Thanksgiving and the Super Bowl.” I have seen this to be true.
This seems to align with the 1004 assumptions shown on page 2 where we report closed sales over the past 12 months. But should we be using the 12-month assumption on page one of the URAR where we report Property Values in the One-Unit Housing Trends? If my subject market is stable year-over-year, but down since June, do I report stable? Do I say declining because my comps came under contract and closed while prices were declining? Should a normal seasonal decline affect my interpretation of the market? Year-over-year things are fine, but I see storm clouds ahead. Maybe this time the downturn is both seasonal and rate driven.
Check out this quote from economist Elliot Eisenberg PhD on 11/1/2022:
After rising monthly since 2/12 and peaking in 3/22 with an appreciation rate of 2.1% per month, home prices have now declined for two consecutive months. Moreover, the most recent August decline of 0.86% M-o-M is the largest decrease since 2/10. On a year-over-year basis, after peaking in 3/22 at 20.8%, appreciation declined to 15.6% in 7/22 and 13% in 8/22, with this most recent 2.6 percentage point decline [being] the largest ever.
Here is more from S&P Case-Schiller Home Price Indices. Case-Schiller uses monthly comparisons that are seasonally adjusted. As I write this in early November, the data is current as of August. It shows August 2022 at 231.34, up 7.7% from August 2021 at 214.87.
But here is the catch: Case-Schiller seasonally adjusted is down six-tenths of 1% in the most recent monthly interval. Could this be due to a rise in interest rates and the effect of interest rates on affordability?
(story continues below)

(story continues)
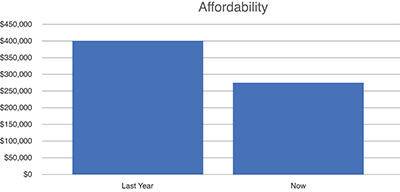
Rates for a 30-year conventional mortgage for the week of October 27, 2002 were 7.08%. One year prior they were 3.14%. Rates have more than doubled. See Figure 2, the effect on affordability is drastic.
Let’s say a buyer had 5% down and bought a $400,000 house one year ago. Payments including PITI and PMI came to $2,390. How much house could this buyer purchase with the same $20,000 down payment and a $2,400 per month payment at 7% interest?
The answer is $275,000. PITI plus PMI of $2,400 borrows $255,000. Add the $20,000 down payment and you have $275,000. Affordability drops 31% from $400,000 to $275,000.
A few months ago, I asked a friend in the mortgage business about affordability. He said many of their borrowers were using adjustable rate mortgages. My mind flashed back to 2007 when ARMs were being used to refi out of prior ARMs which were like ticking time bombs. It was good for refi volume but a bad idea long term for borrowers and lenders.
It does not take much of an imagination to see how this may affect appraisers a few years down the road. We may see a repeat of the 2010 foreclosure peak. Some of those foreclosures were blamed on inflated appraisals and appraisers got sued.
Enlarge image
Figure 2: Affordability
How do you protect yourself? The first step is to recognize the risk of not properly applying market time adjustments. We need to get out of the year-over-year mentality until we have
passed the point at which the market changed. We also need to think critically about the 1004MC. The GSEs no longer require this but some lenders still want to see it. In my market, there are usually too few sales in the 3-month ranges to compare medians and analyze trends. When using the 1004MC, be sure to comment in the space provided about other methods to support your findings on
market conditions.
We need to “up our game” on workfiles. Proper support for market condition findings needs to be documented. Within the past year, I have been using Excel mostly as a way to keep screenshots of what I see on screen. As Josh Wallitt says, “if you see it, save it.” Excel was not designed for this purpose but it is ideal because the space to paste screenshots seems limitless. I subscribe to Microsoft 365 which includes Excel, Word, PowerPoint and OneDrive. OneDrive automatically saves my Excel-based workfile. It is a single document that can also be saved to the workfile section of most forms of software.
You don’t need to know the first thing about spreadsheets to use Excel as a screenshot archive. But now is a good time to learn Excel for market conditions support. To start with, your MLS probably exports data as a CSV file that will open in Excel. Any search of properties can be exported to Excel for analysis, such as close date and close price of competitive properties for a time period you specify in a geographical area of your choice allows you to analyze price trends, for example.
Case-Schiller price index data can be imported to Excel from FRED, Federal Reserve Economic Data. The problem with the Case-Schiller data is that it is not specific to your subject property characteristics, and the data you need is not available for a few months after you need it.
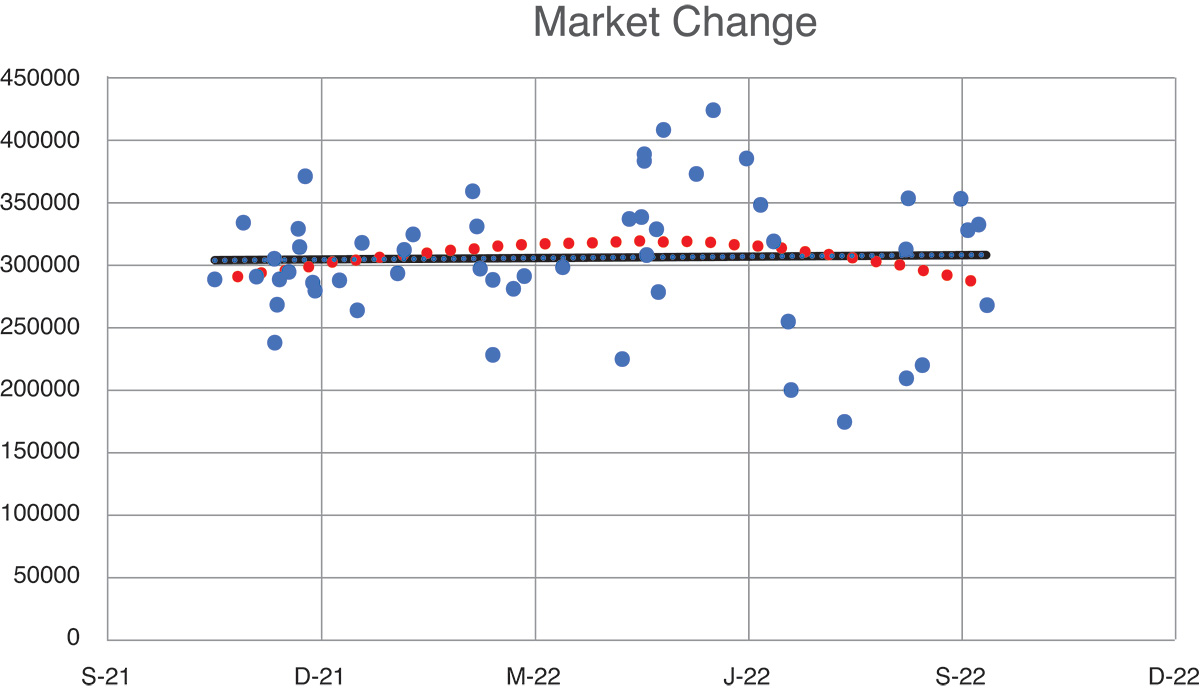
The best way forward is to learn time series analysis as taught by George Dell and Craig Gilbert. Learn best practices for selecting MLS data. Learn how to configure an export in your MLS to get the data you need into a spreadsheet. Learn how to insert a scatterplot with your own personal style preferences saved as a template. Feel the satisfaction of preparing a well-designed graphic communication of your findings. Interpret the resulting chart to see when the market turned.
In this case (see Figure 3), the black line shows the market as stable over the past year. The red line shows a market decline around May 1st.
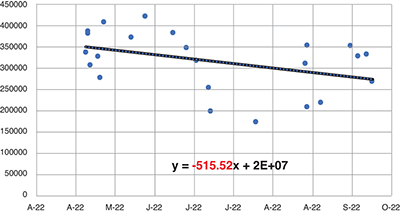
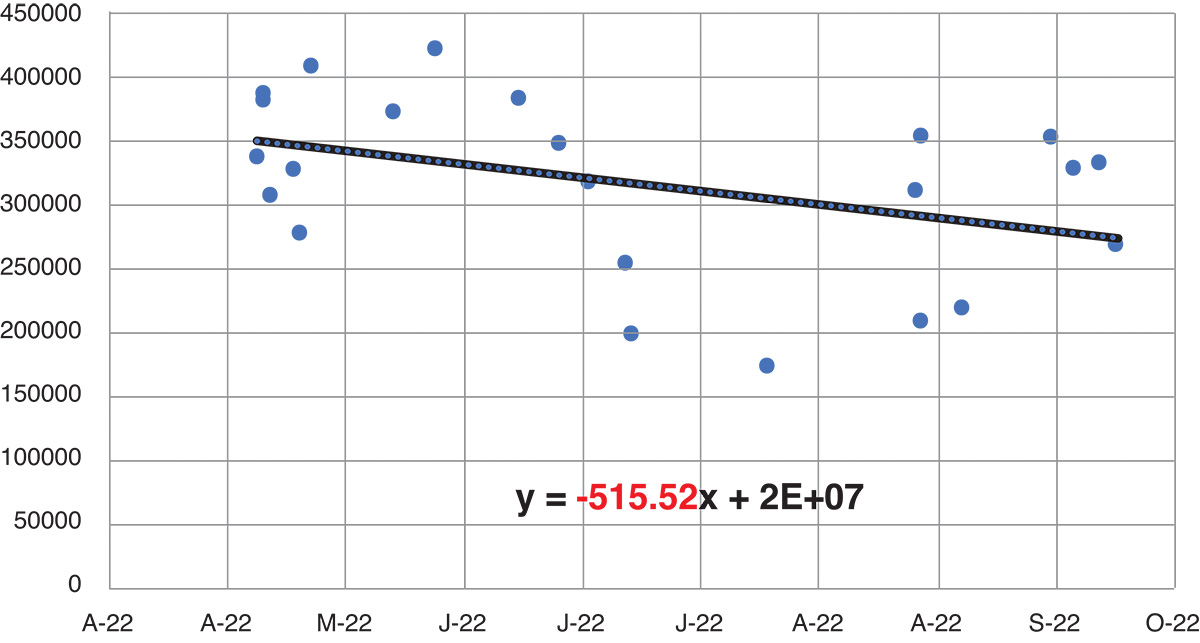
Now select a subset of data from your original export that starts when you know the market turned (see Figure 4). Create another chart focusing on the crucial recent data that will show you the dollars per day to adjust comparables that closed back when the market was higher. In this case -$516 per day.

Enlarge image
Figure 3: Market Change
Enlarge image
Figure 4: $/Day Change Since 5/1/22
Most of us learned how to adjust on the way up in our recent, low interest rate seller’s market. We could not ignore time adjustments any longer.
Grouped data worked well because comparing medians at two points one year apart made sense when the trend was up for the past few years. But times have changed rapidly. In today’s market, you need to know how to spot a turn in the market and how to support adjustments no matter which direction the market moves.
Many of us are in a danger zone because our markets are changing too fast for our old way of calculating market time adjustments. We are at risk of over-valuing properties that may be under water a year from now if rates stabilize at historic levels.
About the Author
Scott Cullen is a Certified Residential appraiser from Eagan, MN who is a partner in the development of the Solomon Adjustment Calculators, designed to quickly evaluate the tradeoffs encountered by residential appraisers, including the depreciation/site value dilemma. There is a free 14-day trial and you are welcome to contact me for a demo over the phone using live examples from your market: www.solomonappraisal.com.
OREP Insurance Services, LLC. Calif. License #0K99465
by Richard Jackson
A nationwide lender I do appraisals for has their own appraisal division rather than opting to use AMCs (lucky for me). When I contacted the manager of the division regarding market trends, he stated that they regard changes within the 4% to 8% range as stable market conditions.
-