

 |
>> See Past News Editions >> Click to Print 2015 Expert’s Guide to Defensible Workfile “I purchased the (ebook) and found it to be extremely valuable. Every appraiser should want this in their library.” -Lawrence J. Dellegrotto, Director of Pennsylvania Real Estate AcademyProtect your license and your livelihood beginning today with the Expert’s Guide by Tim Andersen, MAI. Find quick tips from an expert on how to produce highly defensible reports that keep you safe and raise the quality of your product. Click now2015 AMC Guide – Recently Updated JUST UPDATED 2015 AMC Guide helps increase orders so you can turn down low-fee AMC work, negotiate fees from a position of strength and confidence and refuse to work for the AMCs that undervalue you. Start 2015 off with a new book of clients! Work with the best and fire the rest. Click now |
Supporting Market Conditions Adjustments
by Rachel Massey, SRA and Tim Andersen, MAI
It’s time to understand that appraisers must support their market condition adjustments. This has always been a Fannie Mae requirement. And it’s not only required by Collateral Underwriter (CU), the Uniform Standards of Professional Appraisal Practice (USPAP) also require it. So, in this article we’ll cover one way to support market condition adjustments. This method is USPAP compliant, totally market-based and should satisfy even the most demanding reviewer.
One caveat though. While the back-up data are from the local MLS, the appraiser must graph those data, as the exhibits herein show them. This is going to take extra work on the appraiser’s part. However, this extra time spent initially will pay dividends by saving you valuable time in the future when responding to requests for more information from lenders, underwriters, AMCs and reviewers. That sounds pretty good, don’t you think?
This analysis uses median prices, rather than average or modal prices. That is the appraiser’s choice. The use of mean, median or mode prices is not what is important. What is important is that the appraiser use the one that makes sense in a particular market. This may require the appraiser to analyze a market using all three, and then pick the one that is most reflective of what that market is doing at any given time.
Market Influences
SR 1-2(3) requires appraisers to indentify the “…physical, legal, and economic attributes…” which influence a property’s value and marketability. Part of the analyses behind this identification is a determination of the subject’s submarket and how it changes due to the influences behind it. Markets are not static. The market is always under influences related to supply and demand, the buyer’s ability to pay, and seller’s ability to sell.
Even in stable markets there are forces at work that could unsettle the market at a moment’s notice. Think about how an increase in interest rates can quickly affect a buyer’s ability to afford a mortgage. Think how low interest rates on an existing loan could cause a seller to pause prior to placing a house on the market. If an owner has a favorable interest rate on an existing mortgage, and the mortgage is already significantly paid off, that owner might not be as eager to sell and purchase anew at a potentially higher interest rate. It might simply make more sense for that owner to remodel or add on to the existing dwelling as opposed to selling and moving on.
When markets have more buyers than sellers, buyers often are at an extreme disadvantage, finding themselves competing with many others for desirable properties: resulting in “bidding wars.” From local brokers, we have seen contracts stating that the buyer will pay over and above any other offer, and they will make up the difference between the contract price and appraised value, realizing that in this type of inflationary period, the only way they may be able to purchase a house they want is to overpay. In markets such as these, while the price of a property is clear, its value is far less so. This is because buyers are bidding to overcome the clear shortage of housing in a particular submarket at a particular time. They are not seeking shelter only, their bids represent a non-real estate component.
(story continues below)

(story continues)
Measuring Market Influences
As appraisers, we need to measure the market for each and every appraisal we complete. We need to know whether prices are increasing in an undersupplied market or declining in a weak and/or oversupplied market. If the market is truly balanced between supply and demand, we need to be measuring this as well.
There is more than one way to arrive at a conclusion related to market direction, as well as support adjustments related to changing market conditions. The following information is the method I use to determine both market direction as well as the dynamic that exists between supply and demand factors. It is labor-intensive from the standpoint of having to run data for multiple periods of time and in more than one market segment. However, it also provides an excellent measure of how the markets are behaving in a geographic area.
For the purposes of comparison, I concluded that the boundaries of the local school district are reasonable for determining the larger market. These sales and listing data pertinent to the entire school district do not include any distressed and/or “to-be-built” sales or any data pertinent to a particular submarket that I have under study.
The graph below shows the school district data in blue, with the submarket data in orange. While we actually ran more data, we believe the following is sufficient to indicate market direction. The subject for this example is a hypothetical 2,500 square foot house, built in 1998 on a quarter-acre site in a standard subdivision, including the townships, on the west side of Ann Arbor. The graph shows the school district as a whole, as well as the subject’s submarket. The charts also show both median sales prices and median prices per square foot for both of these markets for further comparison purposes:
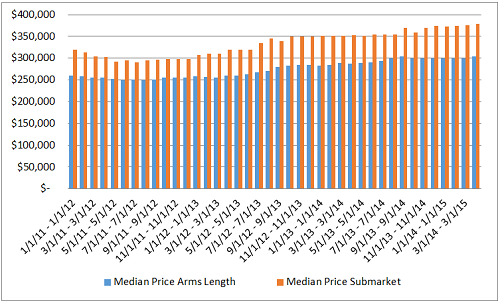
Monthly data in median price
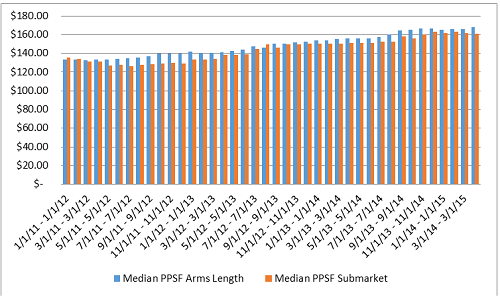
Monthly data in median price per square foot
The two charts above compare median sales price for the entire Ann Arbor market (sans foreclosure and distress sales) compared to the west side of town, narrowed in size and age. The narrowed market is more the “submarket” in which the subject competes, and the wider market is the entire school district.
The data above are from one year, run in monthly segments. Doing it this way provides a more nuanced view of market trends, rather than simply comparing one year to another. Breaking the year into months shows smaller and/or seasonal shifts in the market. Via this division, you can actually compare the month your comparable sale went under contract to the effective date of the appraisal. Running both median price and median price per square foot is important because sometimes median sizes change over time, and smaller house sales will show the market as declining when it is not, and larger house sales will show the market increasing when it is not.
As house sizes increase, normally the price per square foot decreases. Conversely, as house sizes decline, price per square foot increases. This is related to the underlying site value. It is known as the law of diminishing (or decreasing) returns which is addressed succinctly in the Dictionary of Real Estate Appraisal, 14th Edition on page 32 of that text. Considering both and blending the results is a great way to analyze the change over time.
In this instance, there are enough sales in each market period (minimum of 30) for reasonably credible market data. Then, if we lay out the last year’s sales in grid format, we can easily mark the time range where the comparable sold to the present submarket:
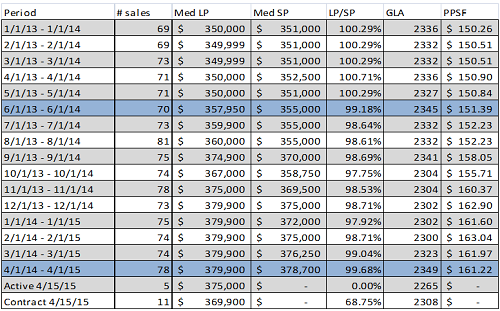
If the comparable sale went under contract on June 1st, 2014 we would use the 6/1/13-6/1/14 data to compare to the 4/1/14-4/1/15 data. That shows a median sales price change from $355,000 to $378,700 or an increase in price of 6.68%. It also shows a change of $151.39 to $161.22 per square foot or an increase of 6.49% in the median sales price per square foot.
It would also make sense to compare the larger market too. The June 2014 to April 2015 data in this segment is 5% for the median price and 7.79% on median price per square foot, or overall 6.93% in that time frame, very similar to the submarket data. This would be support for a positive or upward market conditions adjustment of around 6%. However, that adjustment would also need to be supported through the sales themselves. If the data do not appear correct when applied, then the appraiser simply has to use his/her best judgment and then explain it. When you look at the data in the grid it is obvious that there was a period of increasing prices, followed by five months or so of stability. That would indicate no market conditions adjustments would be appropriate for the recent sales but would be for older sales.
The contract-to-listing ratio is simply how many houses are under contract compared to how many of them are on the market at the time. In the sample submarket, there are sixteen houses on the market, eleven of which are under contract, or a 68.75% contract-to-listing ratio. This means the market is very active. Given there were 78 sales in the last one-year period prior to the effective date, but only five active listings, there is less than a one month’s supply of inventory.
(story continues below)
(story continues)
These data related to the contracted sales is also something that can be used to a degree. But because it is not a full year of sales, the appraiser must use them cautiously. Nevertheless, in this sample, the contracted sales have a lower median price from that of the previous year. But then there are only 11 compared to 78, and the median size is slightly lower. However, it is worth noting this in any explanation of the data the appraiser may include in the report. Between the time we wrote this article and when it was updated, nine days had elapsed. In that time, and in this submarket, the contract-to-listing ratio increased to 73.68%, with the median active and contract prices increasing as well. This indicates that the market is in flux and increasing as the spring buying season heats up, after a really long and bitterly cold winter.
Conclusions
Both USPAP and the Fannie Mae Selling Guide (i.e., CU) require appraisers to support their conclusions, adjustments, opinions and so forth. There are many ways to support such adjustments. The two charts in this article analyze both sales and listings, necessary components of any appraisal analysis. For comparison purposes, this article used a larger market area (a macro-area analysis), as well as a submarket area (a micro-area) analysis to isolate their differences.
In using both a macro- and a micro-analysis of a general area, we can compare them. This comparison not only lets us read what these two markets are doing over a 12-month period (e.g., that they are indeed different markets), it also allows us to quantify that difference. That process of quantification supports, for example, a market conditions adjustment from one market to another (if it were necessary to go out of the submarket to find comparable sales).
Remember that an appraiser’s analyses of a market or submarket is only as complete as the data the appraiser analyzes. Generally, the more data the appraiser analyzes, the more thorough, complete, and market-based are the appraiser’s opinions and conclusions. Notice as well that SR1-4 requires the appraiser to “…analyze all information necessary for credible value results” (emphasis added). In this instance, to arrive at a location adjustment, it was necessary to analyze the data in both a larger market, as well as a specific submarket. That’s what “all” means in SR1-4.
Upcoming Live Webinars:
MAY: Bulletproof Appraising: Fannie Mae, Due Diligence and Your State Board – (Two-Part Webinar)
Presented by Tim Andersen, MAI
Part 1: May 12th, 10 – 11:30 a.m. PST
Part 2: May 19th, 10 – 11:30 a.m. PST
Are you prepared to successfully defend your work against inquiries from Fannie Mae, your state board and your AMC/lender clients? This webinar is designed to share an expert’s knowledge of what it takes to protect yourself. Gained through years of defending appraisers before their state boards, over real-life reporting issues, USPAP expert Tim Andersen, MAI helps you fill in any experience or knowledge gaps in your practice so you can appraise confidently and successfully. Learn More/ Sign Up Now!
JUNE: How to Support and Prove Your Adjustments – A Closer Look
Presented by Richard Hagar, SRA
Part 1: June 4th, 10 – 12:00 p.m. PST
Part 2: June 11th, 10 – 12:00 p.m. PST
“It was a great webinar, now I need to redo all my reports for the last 30 years!” – Sharon
Updated and expanded, Hagar shows you how to properly support your adjustments- the foundation of good appraising! Regulations state that appraisal adjustments cannot be based upon an appraiser’s opinion. Failure to provide proper proof and analysis to support your adjustments means a rough road ahead: state board complaints, panel removal, lawsuits, even license revocation. Fannie Mae cites “the use of adjustments that do not reflect market reaction” as the number one reason an appraiser can be “blacklisted.” This training is critical in helping appraisers avoid catastrophic appraisal failures. Learn More/ Sign Up Now!
>Click to Print
>New: Collateral Underwriter Blog: Find answers, offer solutions.
>Opt-In to Working RE Newsletters
Send your story submission/idea to the Editor: dbrauner@orep.org