


 |
“One of the best courses that I have had in 17 years!” -Amy H.
|
Paired Sales Using Percentage Adjustments and No Recent Sales
by Phil Spool, ASA
Have you ever had a subject property, with no recent comparable sales, with a characteristic considered to be vital to the overall property value? Here’s what to do.
I had an interesting appraisal assignment where the subject needed a view adjustment, since a significant part of the value was due to the view. It was a condominium unit in Miami Beach that faced the Atlantic Ocean. All of the most recent sales faced the city and the most recent sale of a similar ocean/beach view like the subject occurred in September 2016. My date of valuation was March 2018, or 18 months after the sale. How do you handle a situation like this?
Before I get into the particular methodology, I feel compelled to briefly explain paired sales analysis, as many appraisers include only a boilerplate statement that their adjustments are based on a paired sales analysis, but when their workfile is reviewed, there turns out to be no support in either their workfile or their appraisal report.
Paired Sales Analysis
Ideally, comparable sales used for analysis in the sales comparison approach are identical to the subject property, thus no need for any adjustments. But this rarely happens. Theoretically, the subject property is compared to comparable sales, and adjustments are made to the comparable sale for their differences. The most common method used for supportable adjustments is paired sales analysis. The easiest support for an adjustment is when there is only one feature that is different between two comparable sales, which sold around the same time. The more paired sales that are analyzed, the more supportable the adjustment. Adjustments are made to the comparable sale, not the subject. This is a simple and logical statement and usually an exam question in a beginner appraisal course.
Either a dollar adjustment or a percentage adjustment can be made. A simple example of a dollar adjustment would be that the subject single family residence has a swimming pool. One sale similar to the subject with a swimming pool recently sold for $400,000 while another sale without a swimming pool recently sold for $375,000. The dollar difference of $25,000 would reflect the contributory value of the swimming pool. But how do you handle a paired sales analysis if there were no recent sales to use for comparison?
No Recent Sales for Comparison
Percentage adjustments are best used when the sales are not recent and market conditions may or may not have changed from the date the sales occurred to the date of valuation. This article will discuss three scenarios that require an adjustment with no recent sales similar to the subject’s attribute.
The first scenario is a condominium unit with no recent sales with a similar ocean/beach view. However, there was a recent sale with an inferior (city) view and two older sales, one with an ocean/beach view and the other with a city view. The second and third scenarios involve valuing a vacant golf course lot with no recent lot sales on the golf course. A successful paired analysis for this required looking back in time and finding two lot sales that we can compare—one being a golf course lot and the other a non-golf course lot. All three scenarios are similar in that there is only one variable (characteristic) that needed an adjustment.
The methodology of percentage adjustments is the same for all three scenarios. The procedure is to look for the most recent sale with the same attribute (feature) as the subject. Once that sale is found, find a corresponding sale with a different attribute that was close in date of sale. If not available, then search further back in time until you come across the next sale with the same attribute as the subject. Look for a corresponding sale with a different attribute that is close in date of sale. If unable to obtain corresponding sales within a similar time frame, repeat this process until you find a sale with the same attribute as the subject, with a corresponding sale without the same attribute but very close to the date of sale. Once this is found, determine the percentage difference between the two sales (one with and the other without the same attribute as the subject).
When applying a percentage adjustment, time is not a factor when the paired sales are analyzed with the same month/year or close to the same month/ year. A dollar amount adjustment is not appropriate as the market may fluctuate over time, whereas the percentage difference at one time period is carried over to other time periods.
Scenario One: Ocean View vs. Non-Ocean View
Your assignment is to arrive at a current market value as of June 2018 for a 1,250 square foot condominium unit with an ocean/beach view. In researching for comparable sales, you come across a sale of a city view unit that sold in May 2018 for $385,000 or $308.00 sales price per square foot (SP/SF) (Sale 1). However, there were no sales of an ocean/beach view unit that sold close to the date of sale of the city view unit. Additional research resulted in one unit with an ocean view that sold in June 2016 for $400,000 or $320 SP/SF (Sale 2) and one unit with a city view that sold in May 2016 for $300,000 or $240 SP/SF (Sale 3). These two sales have to be very similar but not necessarily exact to each other in other attributes such as floor level, condition of unit and similar renovations, if any. The analysis can be done with a dollar amount comparison instead of price per square foot, assuming your sales are the same or very similar in size to each other and to the subject unit. If not similar in size, the analysis must be performed on a sale price per square foot. In either case, the paired sales analysis conclusion is calculated on a percentage basis.
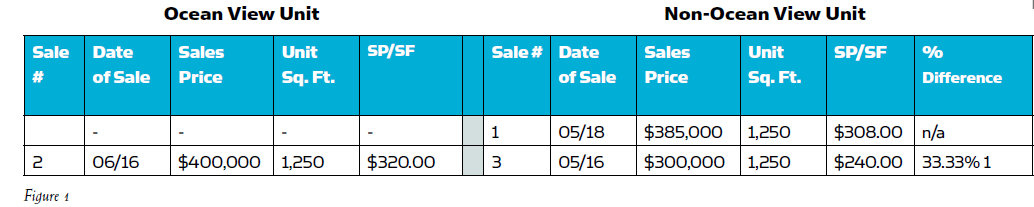
Figure 1
Feature:
Ocean View vs. Non-Ocean View
Date of Value: June 2018
See Figure 1.
The difference in the ocean view unit (Sale 2) at $400,000 and the non-ocean view unit (Sale 3) at $300,000 is $100,000. The $100,000 is divided by the $300,000 sales price, which equates to a 33.33 percent difference due to the view.
(story continues below)

(story continues)
The dollar adjustment for an ocean view unit (subject) would be based on the non-ocean view unit sale in May 2018 (the most recent sale) of $385,000 x 33.33 percent or $128,320 (rounded to $128,000). Therefore, the subject unit with an ocean view would be $513,000 ($385,000 + $128,000). Keep in mind that this would be a supportable adjustment assuming there are no other differences between the sales, such as renovations, etc. All other differences have to be adjusted in order to determine the correct view adjustment.
Percentage Adjustment on a Per Square Foot Basis
Certain analyses are better performed on a per square foot basis. The best example of this would be valuing a vacant lot, as lot sizes vary and size might matter, especially if the subject lot is several thousand square feet different than your comparable sales. When valuing a lot, an analysis on a per square foot of lot size is best due to the varying lot sizes. Regarding the second and third scenarios, the paired sales analysis procedure is to:
• Determine the difference in the SP/ SF of a golf course lot sale and a non-golf course lot sale;
• Take this difference and divide by the non-golf course lot sale SP/ SF—the result would be the percentage difference between the two properties;
• Take this percentage difference and multiply it by the most recent non-golf course lot sale per square foot, and add that to the non-golf course lot sale SP/SF.
Scenario 2: Golf Course Lot vs. Non-Golf Course Lot Adjustment
Imagine you are given an appraisal assignment to value a vacant 15,000 square foot lot that is located on a golf course with a current date of value (June 2018). The following analysis would be considered if there were no recent golf course lot sales (or any other individual feature that makes it distinct from other sales).
Just like the analysis of Scenario 1 with the condominium unit, you first look for vacant lot sales on a golf course. If there are no current sales, the next step is to look for the most recent vacant lot sale on a golf course. It may be anywhere from one to three years from the date of value before you find your first golf course lot sale. Once you find a sale, look for a non-golf course lot sale of similar lot size in the subject’s neighborhood that sold around the same time period. If you cannot find a non-golf course lot sale around the same time as that golf course lot sale, move on to the next golf course lot sale and look for a non-golf course lot sale with a corresponding time period. The purpose is to perform a paired sales analysis with a golf course lot sale compared to a non-golf course lot sale, that sold around the same time (preferably one to three months apart in a stable market).
In researching for comparable sales, you came across a golf course lot but it sold in September 2017, nine months prior to your valuation date. Additional research resulted in a current sale not on the golf course that sold in May 2018, and another in August 2017.
Scenario # 2: Golf Course Lot vs. Non-Golf Course Lot Adjustment—
without difficulty matching a golf course lot with a non- golf course lot that sold around the same time.
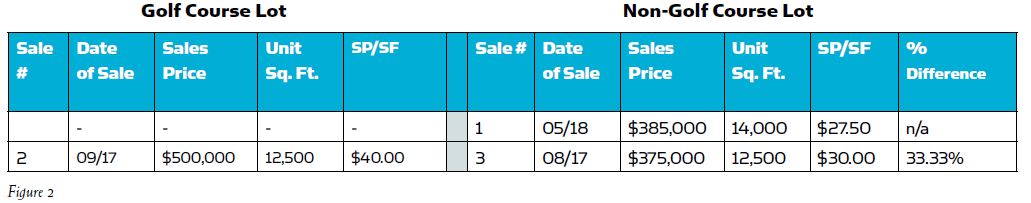
Figure 2
Feature: Golf Course Lot Vs. Non- Golf Course Lot
Lot Size: 15,000 sq.ft.
Date of Value: June 2018
See Figure 2.
• Take the sales price for the golf course lot of $40/SF (Sale 2) and subtract the non-golf course lot of $30/SF (Sale 3), which is $10/SF.
• Divide the $10/SF by the non-golf course lot PPSF ($30), resulting in a percentage difference of 33.33 percent.
• Multiply 33.33 percent times the recent non-golf course lot sale of $27.50/SF (Sale 1), resulting in $9.17 SPSF. ($27.50/SF x 33.33 percent = $9.17).
• Add the $9.17 to the $27.50, which results in a current value for the subject lot of $36.67/SF.
• Multiply $36.67 /SF x subject’s 15,000 SF lot size, which results in a value for the subject at $550,050 or $550,000 rounded.
The three most important things to remember are:
• Convert the sales price to a sales price per square foot;
• Do a paired sales analysis based on the most recent sale of a feature similar to the subject with a sale that is very close to that date that does not have that feature;
• Round your concluded value after all of your mathematical analysis.
If you value the subject on a dollar amount conclusion instead of a sales price per square foot conclusion, you can possibly get a different result. For the above chart, the dollar difference would be $125,000 ($500,000 less $375,000) divided by $375,000, which also results in a 33.33 percent difference. But don’t apply the 33.33 percent to the $385,000 amount. Instead, apply the 33.33 percent increase by multiplying it by the $27.50/SF amount. The increase should be $9.17/SF. If you mistakenly apply the 33.33 percent difference to the sales price of $385,000, the result would be $128,320 ($385,000 x 33.33 percent). This would result in an incorrect value of the subject in the amount of $513,320 ($385,000 plus $128,320). Remember, the subject’s lot size is 15,000 square feet. Be sure to apply the percentage difference to the price per square foot, not the dollar amount of the sale.
Scenario # 3: Golf Course Lot vs. Non-Golf Course Lot Adjustment—with difficulty matching a golf course lot with a non- golf course lot that sold around the same time.
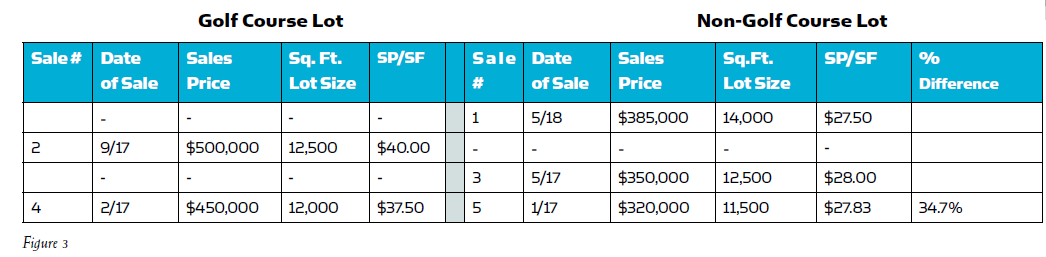
Figure 3
Feature: Golf Course Lot Vs. Non- Golf Course Lot
Lot Size: 15,000 SF
Date of Value: June 2018
See Figure 3.
Again, the three most important things to remember are:
• Convert the sales price to a sales price per square foot;
• Do a paired sales analysis based on the most recent sale of a feature similar to the subject comparing it with a sale that is very close to that date that does not have that feature;
• Round your concluded value after all of your mathematical analysis.
(story continues below)

(story continues)
In researching for comparable sales, you found a current sale of a non-golf course lot sale that sold in May 2018 for $385,000 or $27.50/SF (Sale 1). Your most recent sale of a golf course lot sale was in September 2017 for $500,000 or $40/SF (Sale 2). Researching for a non-golf course lot to use for comparison to the September 2017 sale resulted in a sale in May 2017 (Sale 3), but it is too old for comparison to Sale 2. Additional research resulted in a golf course lot sale in February 2017 for $450,000 or $37.50/ SF (Sale 4), and a non-golf course lot sale that sold in January 2017 for $320,000 or $27.83/SF (Sale 5). Both Sale 4 and 5 are considered good sales for a paired sales analysis to determine the percentage difference between a golf course lot sale and a non-golf course lot sale.
• Subtract PPSF of the non-golf course lot (Sale 5/$27.83) from PPSF of the golf course lot (Sale 4/$40).
• The $9.67/SF difference is divided by the non-golf course lot PPSF($27.83), resulting in a percentage difference of 34.7 percent.
• The 34.7 percent is then multiplied by the recent non-golf course lot sale of $27.50 PPSF (Sale 1), giving a dollar difference of $9.54 PPSF ($27.50 PPSF x 34.7 percent = $9.54), which is then added to the $27.50 PPSF, resulting in a current value for the subject golf course lot at $37.04 PPSF ($27.50 + $9.54).
• The $37.04 PPSF is multiplied by the subject’s 15,000 sq.ft. lot size, resulting in a value for the subject of $555,600, rounded either to $555,000 or $556,000.
If you were to multiply the sales price of $385,000 (Sale 1) x 34.7 percent and add the result of $130,125 to $385,000, you would get $515,125. This does not represent the value of the subject golf course lot as the subject lot size is 15,000 SF and Sale 1 is 14,000 SF. That is why in some situations like Scenarios 2 and 3, the analysis has to be on a price per square foot basis.
Conclusion
Percentage adjustments are best used when the sales are not recent and market conditions may or may not have changed from the date the sales occurred to the date of valuation. Dollar adjustments would reflect that moment in time that your analysis is based on. For an analysis of sales much older than the date of value, the percentage adjustments would carry that percentage difference over time, whether market conditions have changed or not.
New Course: The OREP Education Network is now offering a new online continuing education course, How to Raise Appraisal Quality and Minimize Risk (7 Hrs), designed to help appraisers stay out of trouble with their state boards and avoid lawsuits. Learn to build a stronger workfile and a bulletproof appraisal report. Visit OREPEducation.org today!
“I have recently completed the best appraisal class of my 30 year career (How to Support and Prove Your Adjustments through OREP.) ” -Susan D.
Continuing Education: How To Support and Prove Your Adjustments
Presented by: Richard Hagar, SRA (7 Hrs. Online CE)
“One of the best courses that I have had in 17 years!” -Amy H.
Must-know business practices for all appraisers working today. Ensure proper support for your adjustments. Making defensible adjustments is the first step in becoming a “Tier One” appraiser, who earns more, enjoys the best assignments and suffers fewer snags and callbacks. Up your game, avoid time-consuming callbacks and earn approved CE today!
Sign Up Now! $119 (7 Hrs)
OREP Insured’s Price: $99
About the Author
Scott Cullen is a Certified Residential appraiser from Eagan MN who is a partner in the development of the Solomon Adjustment Calculators, designed to quickly evaluate the trade-offs encountered by residential appraisers, including the depreciation / site value dilemma. There is a free 14 day trial and you are welcome to contact me for a demo over the phone using live examples from your market: www.solomonappraisal.com.
Send your story submission/idea to the Editor: isaac@orep.org