


 |
“One of the best courses that I have had in 17 years!” -Amy H
>> OREP E&O |
Editor’s Note: This article is reprinted from Freddie Mac’s Single-Family division.
Spotlight on Appraiser Capacity During the Pandemic
by Danny Wiley, Senior Director of Valuation for Single-Family Credit Risk Management, Freddie Mac
In November 2020, I shared information about “The Effect of COVID-19 on Appraisal Volume” submitted through the Uniform Collateral Data Portal® (UCDP®)—the appraisal portal shared by Freddie Mac and Fannie Mae. Now that it’s been more than a year since COVID-19 first started impacting everything, I am updating those same numbers and also diving a little deeper into the state-by-state impacts.
Impact on UCDP Volume
2020 was a record year for the number of appraisals submitted through UCDP, also known as government sponsored enterprise (GSE) appraisals. This included the 10 highest-volume months (March–December) since we began collecting appraisals in UCDP in 2012. While there was a precipitous drop in the volume from October to November (from over 700,000 to around 625,000), December 2020–April 2021 saw volumes that remained in excess of 600,000 appraisals (with a spike of over 700,000 in March), all representing record volumes from pre-March 2020. In other words, the 14-month period from March 2020–April 2021 comprises the 14 highest individual monthly volumes in the history of UCDP.
UCDP Volume and Unique Appraiser Licenses
These numbers, including the fact that seven of those months represented volumes in excess of 700,000 appraisals, are staggering (see Figure 1). The numbers become even more staggering in light of the fact that during this time the number of unique appraiser licenses held steady at roughly 40,000 per month.
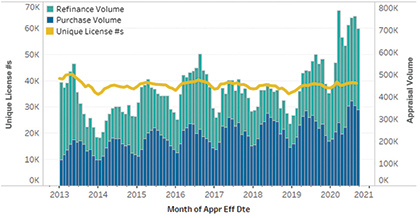
Figure 1: Unique appraiser license numbers in UCDP, per month. Appraisal and license volume for all form types (not limited to 1004/70).
A State-by-State Look 2012–2019
The increase in the GSE appraisals nationwide and the strain it’s put on appraisers is apparent from the numbers mentioned above. When you look at it on a state-by-state basis, you see an even more compelling story (seeFigure 2). Comparing average annual GSE appraisals per appraiser from 2012–2019 against 2020 shows that the numbers go up across the board. You also see a heavy impact on the states that already made up the top 10 highest average numbers. Let’s take a closer look.
GSE Appraisal Volume Against Capacity (2012–2019)
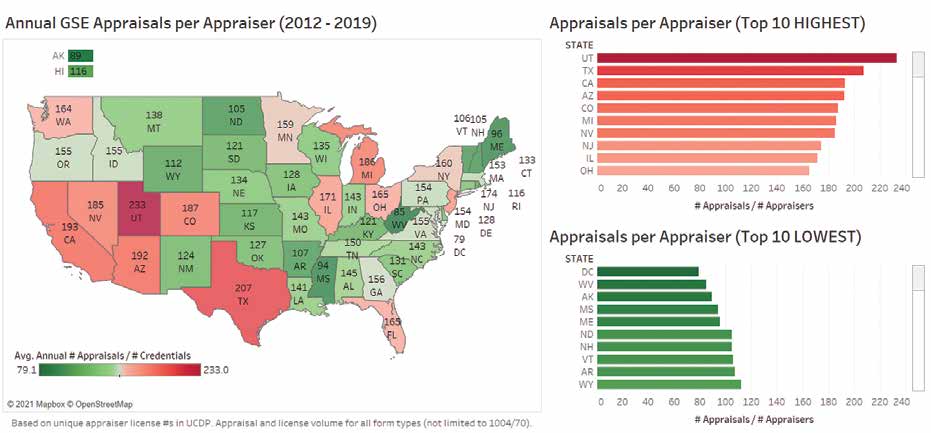
Figure 2: Based on unique appraiser license #s in UCDP. Appraisal and license volume for all form types (not limited to 1004/70).
10 Lowest Volume States Per Appraiser (2012–2019)
From 2012–2019, the states that made up the list of the 10 lowest average GSE appraisals per appraiser (see Figure 2) were heavily situated in the northeast and, not surprisingly, included some of the least populated states in the country (nearly all of them with less than two million people). While it’s not a state, we’ve included Washington, D.C in our research, and it had the lowest volume with 79 average GSE appraisals per appraiser. Rhode Island topped this list with 116 average GSE appraisals per appraiser. Effectively, the appraisers in these 10 lowest states averaged between six and 10 appraisals per month during this eight-year stretch.
10 Highest Volume States Per Appraiser (2012–2019)
The other end of the spectrum during the period of 2012–2019 tells a much different story (see Figure 2). The majority of the states comprising the list of the top 10 highest average GSE appraisals per appraiser were often situated in the western part of the country, and also, not surprisingly, included some of the more populated states, including California, Texas, Michigan, Arizona and Colorado. This group ranged from Ohio (165 average appraisals per appraiser), Illinois (171) and New Jersey (174) at the low end to Utah (233) and Texas (207) at the top end. Overall, the appraisers on this list were averaging about 14–19 appraisals per month from 2012–2019.
As you can see, the workload quickly escalates at this end of the spectrum and, as you’ll learn below, 2020 showed us that a perfect storm of factors could make the situation much worse.
(story continues below)

(story continues)
10 Lowest Volume States Per Appraiser 2020
There was very little change in the states that make up the list of 10 lowest average GSE appraisals per appraiser in 2020 (see Figure 3). While the order of states on the list moved around slightly, the only new state was Kansas, in place of Rhode Island (driven by its 67% increase in per appraiser volume in 2020).
However, with the exception of Vermont, which saw a 48% increase, every one of the states on this list saw increases of over 50% (ranging from 51% to 73%). The largest percentage increases on this list were seen in Mississippi (73%), Arkansas (69%), Maine (68%), New Hampshire (67%) and North Dakota (66%)—all with increases over 60%, with their per appraiser volumes in 2020 ranging from 161 to 181.
As I mentioned earlier, the states making up this list, included per appraiser volumes between 79 and 116 annually from 2012–2019 (or around 6–10 per month). With all but one of them showing increases over 50% (and half of them closer to 70%), the appraisers in these states were much busier in 2020, with per appraisal volumes jumping to 119–181 (or about 10–15 per month). Half of the lowest 10 states in 2020 experienced volumes that would have placed those states in the top 10 from 2012–2019.
GSE Appraisal Volume Against Capacity (2020)
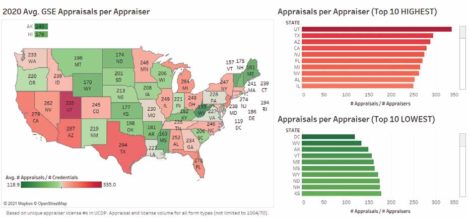
Figure 3: Based on unique appraiser license #s in UCDP. Appraisal and license volume for all form types (not limited to 1004/70).
10 Highest Volume States Per Appraiser 2020
The highest volume states are where the largest impact to appraiser capacity was felt in 2020 (see Figure 3). To start, two new states jumped onto the top 10 highest average list—Florida (6th at 270) and Alabama (9th at 252). And the states they replaced on the list, just missed staying there—Ohio (which tied Illinois for the final spot with 249) and Colorado (245).
Three states on this list saw increases of over 50%, led by the newcomers Alabama (74%), Florida (64%), and New Jersey (57%). Every other state on the list saw increases between 42% and 49%. And while these percentage increases aren’t as dramatic as they were for the lowest 10 list, the overall volume for this already overworked group became even more overwhelming, jumping from 165–233 during 2012–2019 to a massive 249–335. Meaning that the states comprising this list combined to do 46% more appraisals per appraiser (1,893 annually for this group in 2012–2019 to 2,766 in 2020)—or between 20 and 30 appraisals a month on average.
However, the most eye-popping increase in these numbers was at the top of the list. Utah appraisers were already handling the most appraisals, 233 each annually on average between 2012–2019. But in 2020 that number jumped by 102 to 335—a 44% increase that meant they were doing about 28 appraisals per month on average.
Conclusion
The pandemic year of 2020 continuing into the early part of 2021, has shone a bright light on a topic that’s been a growing concern—appraiser capacity. While the scope of that concern has been different throughout the country in recent years, it’s now been brought to the forefront for every state. The pandemic fueled regulation which lowered already-low interest rates and, for a portion of homeowners, home-improvement-related refinances combined with additional factors to create a perfect storm for record appraisal volume, without a corresponding increase in the number of licensed appraisers.
This increased loan origination turn times, impacting both lender margins and the overall borrower experience, as appraisers did their best to manage an influx of assignments. Due to a combination of fast-thinking industry collaboration between the GSEs and the Federal Housing Finance Agency (FHFA), to initiate the temporary appraisal flexibilities and existing automated solutions (e.g., appraisal waivers), some of the burden on appraisers was minimized and the impact to turn times lessened.
I’m proud of the role Freddie Mac played, with the efforts mentioned above, to help keep the loan origination process moving safely for appraisers and borrowers. And I really can’t say enough about the tremendous job appraisers did given the strain these massive volume increases put on them as they worked through a global pandemic.
Now that it’s been a little over a year since the onset of the pandemic in this country, and interest rates have begun to tick up slightly, appraisal volume has also begun to recede slightly from the record highs seen in the fall of 2020. But volume still remains higher than at any time prior to March 2020 and the fall homebuying season is upon us. While the temporary appraisal flexibilities were sunset at the end of May 2021, rest assured that Freddie Mac will continue to monitor appraisal capacity and work with appraisers on new and innovative ways to help them meet the needs of the market as efficiently and effectively as possible.
About the Author
Danny Wiley is Freddie Mac‘s Senior Director of Valuation for Single-Family Credit Risk Management. He is responsible for Freddie Mac’s collateral risk management and its valuation team. He is also responsible for innovation in collateral risk analysis. This article is reprinted from Freddie Mac’s blog.
Tips for Smoother Appraising
CE Online – 7 Hours (45 states)
How to Support and Prove Your Adjustments
Presented by: Richard Hagar, SRA
Must-know business practices for all appraisers working today. Ensure proper support for your adjustments. Making defensible adjustments is the first step in becoming a “Tier One” appraiser, who earns more, enjoys the best assignments and suffers fewer snags and callbacks. Up your game, avoid time-consuming callbacks and earn approved CE today!
Sign Up Now! $119 (7 Hrs)
OREP Insured’s Price: $99
>Opt-In to Working RE Newsletters
>Shop Appraiser Insurance
>Shop Real Estate Agent
Insurance
Send your story submission/idea to the Editor:
isaac@orep.org