


 |
“One of the best courses that I have had in 17 years!” -Amy H.
|
Editor’s Note: The current edition of Working RE is in the mail. OREP E&O insureds enjoy it free!
Risk of Land Volatility
By Scott Cullen, Solomon Adjustment Calculators
Residential assignments often come with a requirement for the appraiser to report an estimate of site value. If there are current lot sales in the subject neighborhood we are able to meet this responsibility head-on. The Appraisal of Real Estate, 14th Edition (Appraisal Institute) states that Sales Comparison is the preferred method. But if the subject is in a fully developed neighborhood with no lot sales, we need to rely on other methods to estimate site value. The textbook options are Market Extraction, Allocation and Income Capitalization.
Income Capitalization requires net operating income and market capitalization rates, so this option is not applicable to a typical residential appraisal assignment. Allocation is often used because land-to-property value ratios can be calculated from readily available assessor data. The idea of using a ratio is reinforced by the need to explain high ratios in the Uniform Residential Appraisal Report (URAR). To use allocation properly, however, assessor data is not the right place to start. The correct procedure is to extract the ratio from comparable sales. To do this, you would need sales of both lots and houses. If you have lot sales, why go any further than Sales Comparison?
Applying a reliable land-to-property value ratio for the neighborhood to the current median price in the neighborhood can provide a test of reasonableness for site value. But if market values are changing, we can veer way off track by using land-to-property value ratios. This opens us up to liability for reporting a misleading assignment result. To illustrate this, let’s go back to the events of 2007 and 2008. “Home prices declined at a record pace around the nation in the final three months of 2008, according to an industry report released Tuesday. The S&P Case-Shiller National Home Price Index reported that prices sank a record 18.2 percent during the last three months of 2008, compared with the same period in 2007” (Christie, Les, CNN Money, March 6, 2009). If a hypothetical house had a market value of $250,000 in Q4 2007, the market value would have dropped to $203,750 by Q4 2008.
Assuming that the hypothetical house had a land-to-property value ratio of 33 percent in 2007, the land would have been worth $82,500. $250,000 x .33 = $82,500. What happens to the land-to-property value ratio when the market drops 18 percent to $205,000? If the historic land-to-property value ratio still holds true, the land would drop to about $68,000. Could you safely report that site value was now in the $68,000 range? Probably not. Here is why that might be misleading.
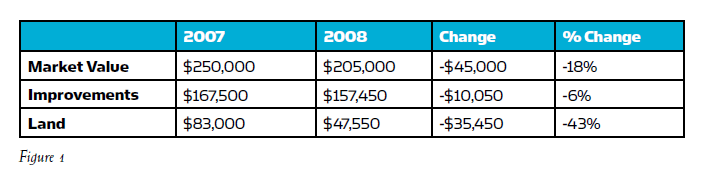
The first reason is that construction costs declined at a different rate. According to the Building Cost Historical Index published in National Building Cost 2018, replacement cost declined 6.2 percent in the same time period. This is determined by comparing the cost index of 1.29 in 2007 to 1.21 in 2008. The second reason is that land, according to our assumption, was 33 percent of market value in 2007. With replacement cost down 6.2 percent, deterioration in land value would have to account for a much larger portion of the decline. See the following table that summarizes the breakdown between land and improvements assuming a decline of 18 percent in market value and a decline of 6 percent in replacement cost (See figure 1).
(story continues below)

(story continues)
The land-to-property value ratio in 2007 was 33 percent. In 2008, the ratio had changed. $47,550 / $205,000 = 23 percent! On the surface, the ratio changed 10 percent. We appraisers, with our trained eye for percentages, know that the ratio changed 30 percent. [(33 percent–23 percent) / 33 percent = 30 percent] Why is this a concern for appraisers? The appraiser’s opinion of site value is an assignment result. Assignment results go beyond the opinion of value at the bottom of page 2 in the URAR. Unimproved land values seem to be more volatile than improved parcels and it is our responsibility to report accordingly.
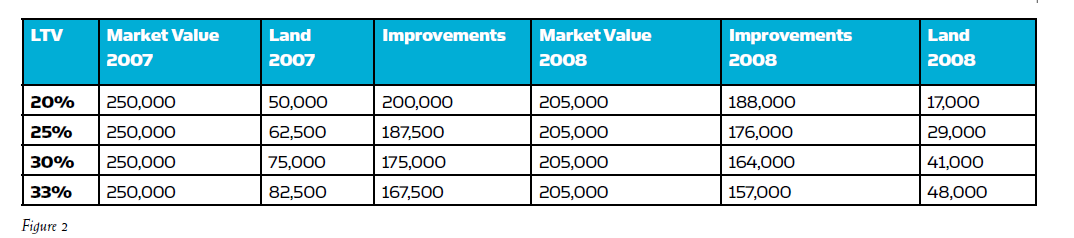
In the table (figure 2), notice how land is much more volatile than house prices. Interestingly, lower land-to-property value ratios result in higher volatility. Values are rounded to $500.
This phenomenon goes both ways. Rising property values are largely due to land value increases. If market value is increasing when construction costs are stable, all of the increase is due to land. Costs were the same in 2013 as they were in 2017, according to National Building Cost data. In the same time period, the Case-Shiller Home Price Index increased from 170.14 (October 1, 2013) to 197.48 (October 1, 2017).
If we continue with our assumption of a hypothetical house value of $250,000 in 2013 and apply the Case- Shiller increase of 16 percent, we are able to reproduce the prior table, this time for a rising market (See below, figure 3).
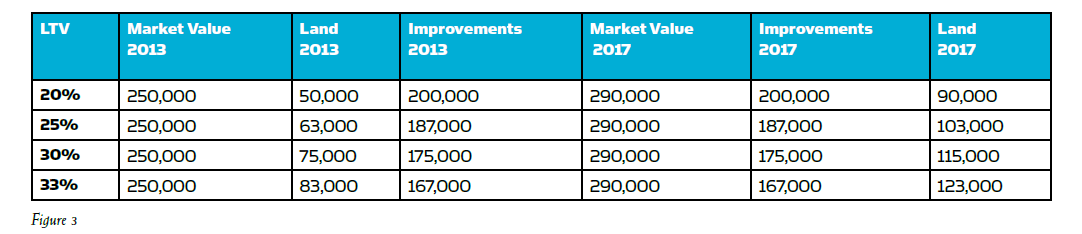
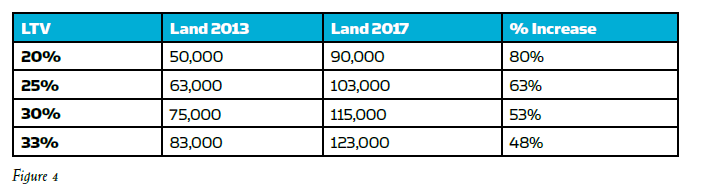
The column on the left shows the effect of differing land-to-property value ratios on site value. Because there is no change in the cost index, the improvements do not change from 2013 to 2017. A necessary inference is that land increases account for 100% of the change in Market Value. This is summarized in figure 4 on below.
Did you notice that regression was not included in the list of methods to develop an opinion of site value? I did not purposely ignore regression; it is simply not listed. My local market is a good example of why regression may not be a dependable choice. I live in a second ring suburb that is separated from Minneapolis / St. Paul by the Mississippi River. The first wave of residential development was in the 1950’s before a major bridge was built. Land was relatively inexpensive and modest houses were built on large lots. As the metro area grew and the river became less of a barrier, the pace of development increased with larger houses on smaller lots. Today, new construction activity is dominated by large, high-end houses on lots that are less than half the size of the original lots. There is a negative correlation between lot size and house size. MLS provides nothing beyond lot size, so regression shows wild results.
(story continues below)

(story continues)
What do we use to develop and support an opinion of site value when there are no recent comparable sales? We have seen that allocation should be based on lot sales and improved parcel sales, so allocation does not help us when there are no lot sales. We have showed why land-to-property value ratios can lead us astray when values are changing. Land values drop faster than house values in a declining market. When house values are increasing, it is likely that land is the reason. Income Capitalization is not applicable to most single family residential assignments. Regression is not listed as a reliable way to develop an opinion of site value when all we have to work with are improved parcels. That leaves us with Market Extraction.
Market Extraction is not without its problems. It works best when the improvements contribute little to property value, as in sales of houses that are demolished for new construction. Market extraction is also recommended in the text when the improvements are relatively new, as there is little depreciation and there is reliable cost data with which to calculate replacement cost.
In my practice, I have found that Market Extraction is the best way forward even for existing houses. The key is being able to accurately estimate effective age on page one. An estimate of effective age will provide a rate of depreciation when it is properly coupled with the economic life that corresponds to the quality rating of the house. Then it becomes a simple matter to use the cost approach to solve for site value by subtracting depreciated cost from market value. Effective age is already included among assignment results that we are responsible for getting right, so it makes sense to strike the most likely balance between effective age and site value.
New Course: The OREP Education Network is now offering a new online continuing education course, How to Raise Appraisal Quality and Minimize Risk (7 Hrs), designed to help appraisers stay out of trouble with their state boards and avoid lawsuits. Learn to build a stronger workfile and a bulletproof appraisal report. Visit OREPEducation.org today!
“I have recently completed the best appraisal class of my 30 year career (How to Support and Prove Your Adjustments through OREP.) ” -Susan D.
Continuing Education: How To Support and Prove Your Adjustments
Presented by: Richard Hagar, SRA (7 Hrs. Online CE)
“One of the best courses that I have had in 17 years!” -Amy H.
Must-know business practices for all appraisers working today. Ensure proper support for your adjustments. Making defensible adjustments is the first step in becoming a “Tier One” appraiser, who earns more, enjoys the best assignments and suffers fewer snags and callbacks. Up your game, avoid time-consuming callbacks and earn approved CE today!
Sign Up Now! $119 (7 Hrs)
OREP Insured’s Price: $99
About the Author
Scott Cullen is a Certified Residential appraiser from Eagan MN who is a partner in the development of the Solomon Adjustment Calculators, designed to quickly evaluate the trade-offs encountered by residential appraisers, including the depreciation / site value dilemma. There is a free 14 day trial and you are welcome to contact me for a demo over the phone using live examples from your market: www.solomonappraisal.com.
Send your story submission/idea to the Editor: isaac@orep.org
by Michael Ford, AGA, SCGREA, GAA, RAA, Realtor®
I’ll probably take Mr. Cullen’s firm up on the free trial offer. Hard to argue with someone willing to say “Try us and see.” Ultimately though, ALL such methods still require an underlying assumption (or more). In this (Solomon Adjuster) case, it’s estimating effective age.
WHY then is it ok to make estimates or assumptions only when we are tying them to circular processes where the results are wholly dependent on those (depreciation) assumptions or estimates of effective age life?
-